People and Economy
![]()


Agricultural expansion is a major driver of deforestation in Cambodia. As such, land use planning and management decisions should consider the key factors that influence land use change, including population dynamics, potential agricultural productivity and infrastructure. Balancing these socioeconomic factors with existing forest ecosystem services is important for sustainable development.
The WESTool offers several layers in the Population and Economy tab describing key features in the landscape that can support analyses of how populations and economic factors affect land use and land use change. It also includes data on remaining forest area versus production lands to help inform the balance between production and protection. Layers include maps of communes, population, access to market, potential agricultural productivity, agricultural yield per hectare and total cultivation area. As is true for all of the WESTool’s tabs, layers be viewed individually or simultaneously.
The WESTool’s Population and Economy tab aims to give decision-makers and other users detailed information about Cambodia’s population and economy, how they vary across the landscape, and how they interact with Cambodia’s ecosystems.
The wealth of information presented in the WESTool’s Population and Economy tab can be valuable for exploring the relationships between population economy and forests historically as well as for shedding light on considerations that should be made in land use planning.
For example, the population layers show the distribution of people across the country and how this has changed over time. The layers on access to market and potential agricultural productivity allow users to gauge the agricultural value of land in different communes and assess how suitable agricultural development might be. The layers on rice cultivation add another component to the assessment of agricultural suitability, allowing users to see how productive rice paddies have been historically in each commune, and how much area in the commune is being utilized for rice cultivation. Finally, WESTool provides information on remaining forest area by commune so that land use planning can take into consideration the balance between conservation and expansion of further production (how much is left to be developed or protected).
Viewing layers simultaneously can provide insights on how various factors interact. For example, to understand how Cambodia’s rice production might be increased to stimulate the economy, users could use these layers to find ideal communes to increase yields or for those that have low rice yields, information on potential agricultural productivity and distance to market could be used to understand areas where yield could be easily increased. Information on population density could be added to understand which communes face population pressures along with cultivation area to understand what communes might have available land for cultivation, as opposed to those that are more urban.
Data layers for assessing socioeconomic factors:
COMMUNE: The map of communes in Cambodia was obtained from Open Development Cambodia[1].
POPULATION 2001 & 2008: 2008 census data at the village and commune levels was obtained from Open Development Cambodia and the global population density dataset LandScan [2]. The 2008 census data at the village scale was made spatially explicit (at the 1 km pixel scale) by projecting the population over the landscape, assigning values proportionally given population density from the LandScan map. To create the 2001 map, the 2008 population numbers from the census were scaled down to match the numbers from the LandScan map in 2001.
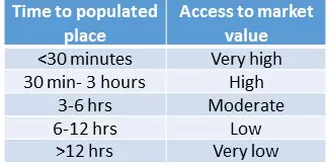 ACCESS TO MARKET: This layer was obtained from the European Union Joint Research Center’s global accessibility map[3]. This global map predicts the travel time to cities with a population of over 50,000, making it a useful proxy for predicting the distance farmers must travel to major markets to sell their product. Travel times were averaged across communes and assigned a a value as detailed in the table to the right.
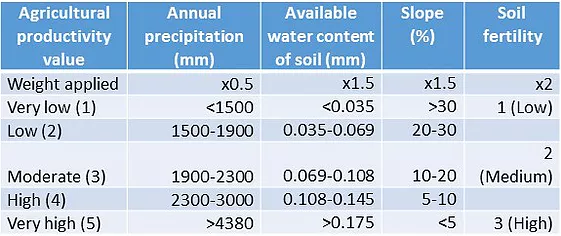
POTENTIAL AGRICULTURAL PRODUCTIVITY: This layer was created by combining several layers that affect agricultural productivity, including (1) annual precipitation (from the global WorldClim[4] database), (2) available water content of the soil (an output from hydrological modeling as detailed in the WESTool Soil and Water Protection page), (3) slope (calculated from a digital elevation model), and (4) soil fertility (obtained from Open Development Cambodia[1]). First, the individual layers were assigned a value 1-5 (as detailed in the table below). A value of 1 corresponds to a very low potential for agricultural productivity, while a value of 5 is very high. Then, the values were summed across the layers for a given location while applying the weighting scheme detailed in the table below, giving certain variables more importance than others.
For example, soil fertility was deemed to be the most important factor in determining productivity so it was given a weight of 2, while precipitation was deemed less important and given a weight of 0.5. The resulting sum was used to give an overall value of agricultural productivity across communes.
YIELD PER HECTARE: This layer was developed using information from the Commune Database downloaded from Open Development Cambodia. The Commune Database supplies a range of commune-level statistics including information on rice cultivation. Total rice paddy yield in tonnes for each commune for both the wet and dry seasons of 2009 were summed and divided by the total number of hectares under rice paddy cultivation in 2009 for both seasons to obtain an average yield per hectare.
TOTAL CULTIVATION AREA: This layer was also developed using information on rice cultivation from the Commune Database. It shows the summation of the total number of hectares under rice paddy cultivation in 2009 for both the dry and wet seasons.
References:
[1]http://www.opendevelopmentcambodia.net/
[3]Nelson, A. (2008) Estimated travel time to the nearest city of 50,000 or more people in year 2000. Global Environment Monitoring Unit – Joint Research Centre of the European Commission, Ispra Italy. Available at http://bioval.jrc.ec.europa.eu/products/gam/
[4]Hijmans, R.J., S.E. Cameron, J.L. Parra, P.G. Jones and A. Jarvis, 2005. Very high resolution interpolated climate surfaces for global land areas. International Journal of Climatology 25: 1965-1978.
Contact: Michael Netzer, Program Officer, Winrock International. mnetzer@winrock.org
How to Cite WESTool
Watershed Ecosystem Service Tool (WESTool). 2017. Beta Version 1. https://winrock.org/westool/. Winrock International
![]()